
Page 40 - Math Course 3 (Book 1)
P. 40
Graphing Systems of Inequalities
The solution is the set of all
ordered pairs whose graphs are
y = –3x + 1 Answer in the intersection of the graphs
of these inequalities.
14
12
y = –3x –2 10
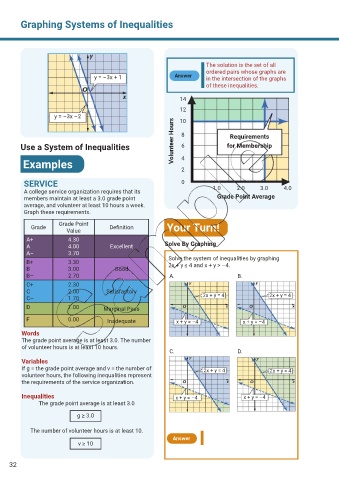
Volunteer Hours 8 Requirements
Use a System of Inequalities 6 for Membership
Examples 4
2
SERVICE 0
A college service organization requires that its 1.0 2.0 3.0 4.0
members maintain at least a 3.0 grade point Grade Point Average
average, and volunteer at least 10 hours a week.
Graph these requirements.
Grade Point
Grade Definition Your Turn!
Value
A+ 4.30
A 4.00 Excellent Solve By Graphing
A– 3.70
B+ 3.30 Solve the system of inequalities by graphing
2x + y ≤ 4 and x + y > –4.
B 3.00 Good
B– 2.70 A. B.
C+ 2.30
C 2.00 Satisfactory
C– 1.70 2x + y = 4 2x + y = 4
D 1.00 Marginal Pass
F 0.00 Inadequate x + y = –4 x + y = –4
Words
The grade point average is at least 3.0. The number
of volunteer hours is at least 10 hours.
C. D.
Variables
If g = the grade point average and v = the number of 2x + y = 4 2x + y = 4
volunteer hours, the following inequalities represent
the requirements of the service organization.
Inequalities x + y = –4 x + y = –4
The grade point average is at least 3.0
g ≥ 3.0
The number of volunteer hours is at least 10.
Answer
v ≥ 10
32