
Page 83 - Math Course 3 (Book 1)
P. 83
Using Functions
Real World Example Ordered Pairs and Tables as Functions
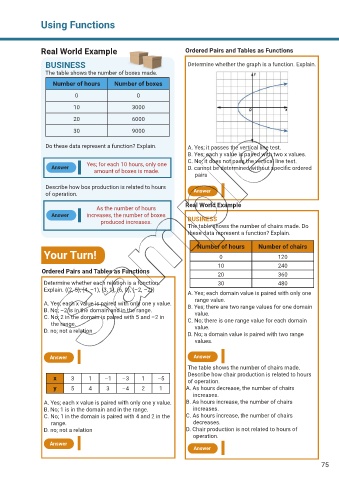
BUSINESS Determine whether the graph is a function. Explain.
The table shows the number of boxes made.
Number of hours Number of boxes
0 0
10 3000
20 6000
30 9000
Do these data represent a function? Explain. A. Yes; it passes the vertical line test.
B. Yes; each y value is paired with two x values.
C. No; it does not pass the vertical line test.
Yes; for each 10 hours, only one
Answer D. cannot be determined without specific ordered
amount of boxes is made.
pairs
Describe how box production is related to hours
of operation. Answer
Real World Example
As the number of hours
Answer increases, the number of boxes
produced increases. BUSINESS
The table shows the number of chairs made. Do
these data represent a function? Explain.
Number of hours Number of chairs
Your Turn! 0 120
10 240
Ordered Pairs and Tables as Functions
20 360
Determine whether each relation is a function. 30 480
Explain. {(2, 5), (4, –1), (3, 1), (6, 0), (–2, –2)} A. Yes; each domain value is paired with only one
range value.
A. Yes; each x value is paired with only one y value. B. Yes; there are two range values for one domain
B. No; –2 is in the domain and in the range. value.
C. No; 2 in the domain is paired with 5 and –2 in C. No; there is one range value for each domain
the range. value.
D. no; not a relation D. No; a domain value is paired with two range
values.
Answer Answer
The table shows the number of chairs made.
Describe how chair production is related to hours
x 3 1 –1 –3 1 –5 of operation.
y 5 4 3 –4 2 1 A. As hours decrease, the number of chairs
increases.
A. Yes; each x value is paired with only one y value. B. As hours increase, the number of chairs
B. No; 1 is in the domain and in the range. increases.
C. No; 1 in the domain is paired with 4 and 2 in the C. As hours increase, the number of chairs
range. decreases.
D. no; not a relation D. Chair production is not related to hours of
operation.
Answer
Answer
75