
Page 150 - Math Course 2 (Book 2)
P. 150
Measure of Central Tendency
Real World Example
CONCEPT SUMMARY
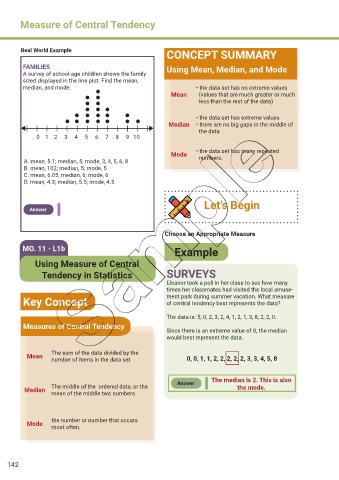
FAMILIES Using Mean, Median, and Mode
A survey of school-age children shows the family
sized displayed in the line plot. Find the mean,
median, and mode. • the data set has no extreme values
Mean (values that are much greater or much
less than the rest of the data)
• the data set has extreme values
Median • there are no big gaps in the middle of
the data
0 1 2 3 4 5 6 7 8 9 10
Mode • the data set has many repeated
A. mean, 5.1; median, 5; mode, 3, 4, 5, 6, 8 numbers.
B. mean, 102; median, 5; mode, 5
C. mean, 6.05; median, 6; mode, 6
D. mean, 4.3; median, 5.5; mode, 4.5
Let’s Begin
Answer
Choose an Appropriate Measure
MO. 11 - L1b Example
Using Measure of Central
Tendency in Statistics SURVEYS
Eleanor took a poll in her class to see how many
times her classmates had visited the local amuse-
Key Concept ment park during summer vacation. What measure
of central tendency best represents the data?
The data is: 5, 0, 2, 3, 2, 4, 1, 2, 1, 3, 8, 2, 2, 0.
Measures of Central Tendency
Since there is an extreme value of 8, the median
would best represent the data.
Mean The sum of the data divided by the
number of items in the data set 0, 0, 1, 1, 2, 2, 2, 2, 2, 3, 3, 4, 5, 8
The median is 2. This is also
Answer
Median The middle of the ordered data, or the the mode.
mean of the middle two numbers
Mode the number or number that occurs
most often.
142