
Page 154 - Math Course 2 (Book 2)
P. 154
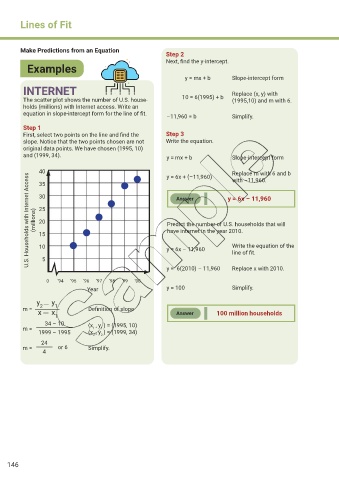
Lines of Fit


        Make Predictions from an Equation
                                                           Step 2
                                                           Next, find the y-intercept.
           Examples

                                                                         y = mx + b  Slope-intercept form


         INTERNET                                                                  Replace (x, y) with
         The scatter plot shows the number of U.S. house-              10 = 6(1995) + b  (1995,10) and m with 6.
         holds (millions) with Internet access. Write an
         equation in slope-intercept form for the line of fit.  –11,960 = b        Simplify.

         Step 1
         First, select two points on the line and find the   Step 3
         slope. Notice that the two points chosen are not   Write the equation.
         original data points. We have chosen (1995, 10)
         and (1999, 34).                                    y = mx + b             Slope-intercept form


               40                                           y = 6x + (–11,960)     Replace m with 6 and b
           U.S. Households with Internet Access   (millions)  30  Predict the number of U.S. households that will
                                                                                   with –11,960.
               35

                                                                                 y = 6x – 11,960
                                                               Answer
               25

               20
                                                            have internet in the year 2010.
               15
                                                                                   Write the equation of the
               10
                                                            y = 6x – 11,960
                5
                                                                                   Replace x with 2010.

                 0   ‘94  ‘95  ‘96  ‘97  ‘98  ‘99  ‘00      y =  6(2010) – 11,960  line of fit.
                                Year                        y = 100                Simplify.

              y   y
                __
         m =   2    1           Definition of slope
              x  __  x                                         Answer        100 million households
                    1
                 34 – 10        (x , y ) = (1995, 10)
         m =                      1   1
               1999 – 1995      (x , y ) = (1999, 34)
                                    2
                                  2
               24
         m =         or 6       Simplify.
                4


    146