
Page 156 - Math Course 2 (Book 2)
P. 156
Lines of Fit
Make Predictions from an Equation
TEMPERATURE
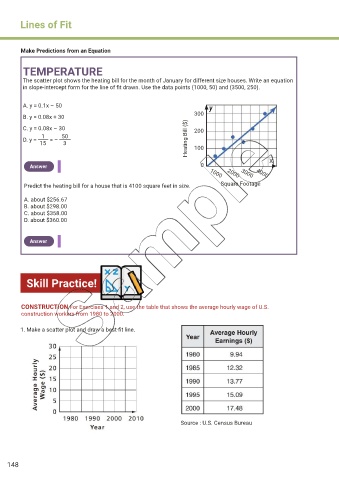
The scatter plot shows the heating bill for the month of January for different size houses. Write an equation
in slope-intercept form for the line of fit drawn. Use the data points (1000, 50) and (3500, 250).
A. y = 0.1x – 50
300
B. y = 0.08x + 30
C. y = 0.08x – 30 200
1 50
D. y = = – Heating Bill ($)
15 3 100
X
Answer 0 1000 2000 3000 4000
Predict the heating bill for a house that is 4100 square feet in size. Square Footage
A. about $256.67
B. about $298.00
C. about $358.00
D. about $360.00
Answer
Skill Practice!
CONSTRUCTION For Exercises 1 and 2, use the table that shows the average hourly wage of U.S.
construction workers from 1980 to 2000.
1. Make a scatter plot and draw a best-fit line.
Source : U.S. Census Bureau
148