
Page 157 - Math Course 2 (Book 2)
P. 157
Lines of Fit
2. Use the best-fit line to predict the average hourly wage of construction workers in 2010.
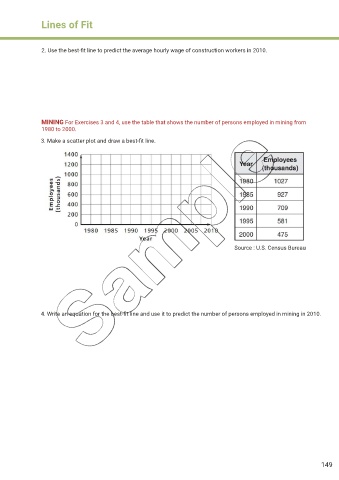
MINING For Exercises 3 and 4, use the table that shows the number of persons employed in mining from
1980 to 2000.
3. Make a scatter plot and draw a best-fit line.
Source : U.S. Census Bureau
4. Write an equation for the best-fit line and use it to predict the number of persons employed in mining in 2010.
149