
Page 90 - Math Course 3 (Book 1)
P. 90
Rates of Change
Compare Rates of Change Negative Rate of Change
Example Example
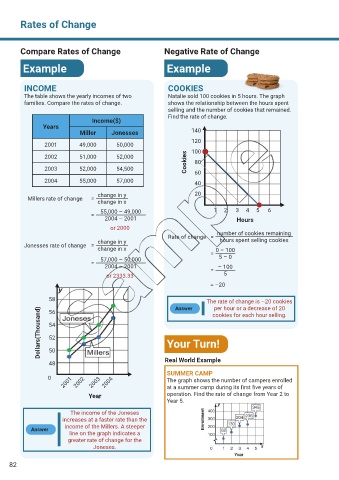
INCOME COOKIES
The table shows the yearly incomes of two Natalie sold 100 cookies in 5 hours. The graph
families. Compare the rates of change. shows the relationship between the hours spent
selling and the number of cookies that remained.
Find the rate of change.
Income($)
Years
Miller Jonesses 140
120
2001 49,000 50,000
2002 51,000 52,000 100
80
2003 52,000 54,500 Cookies 60
2004 55,000 57,000 40
change in y 20
Millers rate of change = change in x
55,000 – 49,000 1 2 3 4 5 6
=
2004 – 2001 Hours
or 2000
Rate of change = number of cookies remaining
change in y hours spent selling cookies
Jonesses rate of change =
change in x 0 – 100
=
57,000 – 50,000 5 – 0
= 2004 – 2001 – 100
=
or 2333.33 5
= –20
58 Answer The rate of change is –20 cookies
per hour or a decrease of 20
Dollars(Thousand) 54 Your Turn!
56
cookies for each hour selling.
52
50
48 Real World Example
SUMMER CAMP
0 The graph shows the number of campers enrolled
2001 2002 2003 2004 at a summer camp during its first five years of
Year operation. Find the rate of change from Year 2 to
Year 5.
The income of the Joneses
increases at a faster rate than the
income of the Millers. A steeper
Answer
line on the graph indicates a
greater rate of change for the
Joneses.
82