
Page 109 - Math Course 2 (Book 1)
P. 109
Linear and Nonlinear Functions
Describe a Linear Function
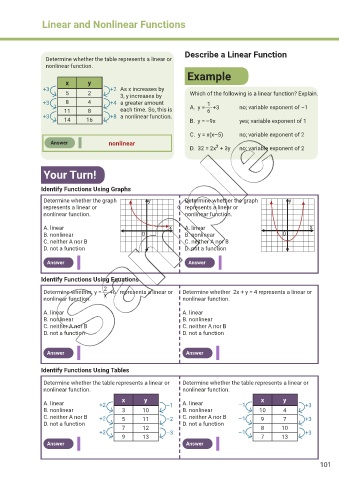
Determine whether the table represents a linear or
nonlinear function.
Example
x y
+3 +2 As x increases by
5 2 3, y increases by Which of the following is a linear function? Explain.
+3 8 4 +4 a greater amount 1
11 8 each time. So, this is A. y = 6 +3 no; variable exponent of –1
+3 +8 a nonlinear function.
14 16 B. y = –9x yes; variable exponent of 1
C. y = x(x–5) no; variable exponent of 2
Answer nonlinear
2
D. 32 = 2x + 3y no; variable exponent of 2
Your Turn!
Identify Functions Using Graphs
Determine whether the graph y y Determine whether the graph y
represents a linear or represents a linear or
nonlinear function. nonlinear function.
A. linear x x A. linear x
B. nonlinear 0 0 B. nonlinear 0
C. neither A nor B C. neither A nor B
D. not a function D. not a function
Answer Answer
Identify Functions Using Equations
2
Determine whether represents a linear or Determine whether 2x + y = 4 represents a linear or
+6
y =
nonlinear function. x nonlinear function.
A. linear A. linear
B. nonlinear B. nonlinear
C. neither A nor B C. neither A nor B
D. not a function D. not a function
Answer Answer
Identify Functions Using Tables
Determine whether the table represents a linear or Determine whether the table represents a linear or
nonlinear function. nonlinear function.
x y x y
A. linear +2 –1 A. linear –1 +3
B. nonlinear 3 10 B. nonlinear 10 4
C. neither A nor B +2 5 11 –2 C. neither A nor B –1 9 7 +3
D. not a function 7 12 D. not a function 8 10
+2 –3 –1 +3
9 13 7 13
Answer Answer
101