
Page 108 - Math Course 2 (Book 1)
P. 108
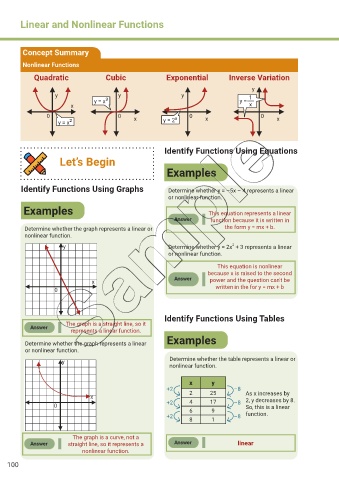
Linear and Nonlinear Functions


         Concept Summary

         Nonlinear Functions

             Quadratic                Cubic                Exponential           Inverse Variation

                                                                                         y
                    y                      y                     y                      1
                                  y = x 3                                            y =
                          x                                                              x
                 0                        0     x             x     0    x                   0    x
                     y = x 2                              y = 2


                                                           Identify Functions Using Equations
                      Let’s Begin
                                                            Examples


        Identify Functions Using Graphs                     Determine whether y = –5x – 4 represents a linear
                                                            or nonlinear function.

         Examples                                                         This equation represents a linear
                                                              Answer       function because it is written in
          Determine whether the graph represents a linear or                    the form y = mx + b.
          nonlinear function.
                                                                                   2
                       y                                    Determine whether y = 2x  + 3 represents a linear
                                                            or nonlinear function.

                                                                             This equation is nonlinear
                                                                          because x is raised to the second
                                                              Answer
                                 x                                         power and the question can't be
                    0                                                        written in the for y = mx + b


                                                           Identify Functions Using Tables
                        The graph is a straight line, so it
            Answer
                          represents a linear function.
                                                            Examples
          Determine whether the graph represents a linear
          or nonlinear function.
                                                             Determine whether the table represents a linear or
                       y y
                                                             nonlinear function.

                                                                    x      y
                                                            +2                     –8
                                 x x                                2      25          As x increases by
                                                            +2      4      17      –8  2, y decreases by 8.
                    0 0                                                                So, this is a linear
                                                                    6      9
                                                            +2                     –8  function.
                                                                    8      1

                           The graph is a curve, not a
            Answer       straight line, so it represents a    Answer                 linear
                              nonlinear function.

    100