
Page 121 - Math Course 3 (Book 1)
P. 121
Linear Equations: Rate of Change
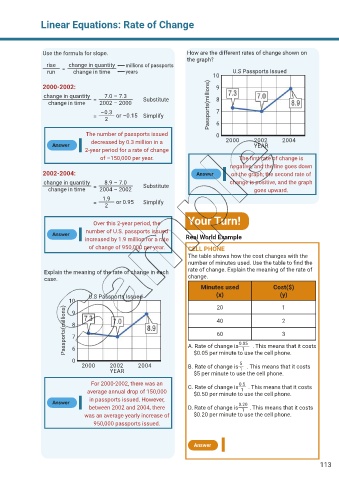
Use the formula for slope. How are the different rates of change shown on
the graph?
rise change in quantity millions of passports
run = change in time years U.S Passports Issued
10
2000-2002: 9
change in quantity 7.0 – 7.3 Substitute 8
change in time = 2002 – 2000 Passports(millions)
–0.3 7
= 2 or –0.15 Simplify 6
The number of passports issued 0
decreased by 0.3 million in a 2000 2002 2004
Answer YEAR
2-year period for a rate of change
of –150,000 per year. The first rate of change is
negative, and the line goes down
2002-2004: Answer on the graph; the second rate of
change in quantity 8.9 – 7.0 Substitute change is positive, and the graph
change in time = 2004 – 2002 goes upward.
1.9
= 2 or 0.95 Simplify
Your Turn!
Over this 2-year period, the
number of U.S. passports issued
Answer
increased by 1.9 million for a rate Real World Example
of change of 950,000 per year. CELL PHONE
The table shows how the cost changes with the
number of minutes used. Use the table to find the
Explain the meaning of the rate of change in each rate of change. Explain the meaning of the rate of
case. change.
Minutes used Cost($)
U.S Passports Issued (x) (y)
10 20 1
Passports(millions) 8 A. Rate of change is . This means that it costs
9
40
2
3
60
7
0.05
6
1
0 $0.05 per minute to use the cell phone.
5
2000 2002 2004 B. Rate of change is . This means that it costs
1
YEAR $5 per minute to use the cell phone.
For 2000-2002, there was an C. Rate of change is . This means that it costs
0.5
1
average annual drop of 150,000 $0.50 per minute to use the cell phone.
in passports issued. However,
Answer 0.20
between 2002 and 2004, there D. Rate of change is . This means that it costs
1
was an average yearly increase of $0.20 per minute to use the cell phone.
950,000 passports issued.
Answer
113