
Page 122 - Math Course 3 (Book 1)
P. 122
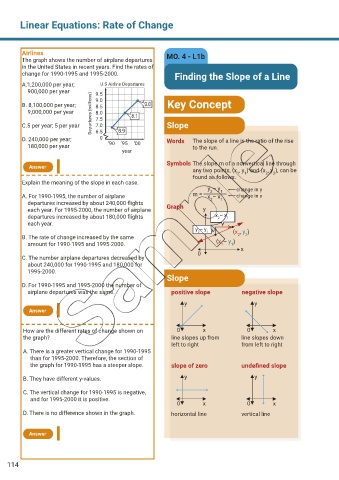
Linear Equations: Rate of Change


         Airlines                                           MO. 4 - L1b
         The graph shows the number of airplane departures
         in the United States in recent years. Find the rates of
         change for 1990-1995 and 1995-2000.                  Finding the Slope of a Line

         A.1,200,000 per year;      U.S Airline Departures
             900,000 per year      9.5

         B. 8,100,000 per year;    9.0                      Key Concept
                                   8.5
             9,000,000 per year  Departures (millions)  8.0
                                   7.5
         C.5 per year; 5 per year  7.0                      Slope
                                   6.5
         D. 240,000 per year;       0                       Words    The slope of a line is the ratio of the rise
             180,000 per year          ‘90  ‘95  ‘00                 to the run.
                                            year

                                                            Symbols The slope m of a nonvertical line through
           Answer
                                                                     any two points, (x , y ) and (x , y ), can be
                                                                                              2
                                                                                                 2
                                                                                    1
                                                                                       1
                                                                     found as follows.
         Explain the meaning of the slope in each case.
                                                                          y – y 1   change in y
                                                                           2
         A. For 1990-1995, the number of airplane                    m =   x – x 1  change in x
                                                                           2
             departures increased by about 240,000 flights   Graph
             each year. For 1995-2000, the number of airplane           y
             departures increased by about 180,000 flights                   x – x 1
                                                                              2
             each year.
                                                                      y – y
                                                                      2   1        (x , y )
         B. The rate of change increased by the same                                 2  2
             amount for 1990-1995 and 1995-2000.                             (x – y )  x
                                                                                  1
                                                                               1
                                                                      0
         C. The number airplane departures decreased by
             about 240,000 for 1990-1995 and 180,000 for
             1995-2000.
                                                            Slope
         D. For 1990-1995 and 1995-2000 the number of
             airplane departures was the same.               positive slope           negative slope
                                                                  y                       y
           Answer


         How are the different rates of change shown on        0        x               0        x
         the graph?                                          line slopes up from      line slopes down
                                                             left to right            from left to right
         A. There is a greater vertical change for 1990-1995
              than for 1995-2000. Therefore, the section of
              the graph for 1990-1995 has a steeper slope.   slope of zero            undefined slope

         B. They have different y-values.                         y                       y

         C. The vertical change for 1990-1995 is negative,
              and for 1995-2000 it is positive.
                                                               0        x               0        x
         D. There is no difference shown in the graph.       horizontal line          vertical line


           Answer


    114